Visualisation
Visualising telemetry emitted from Altinn 3 apps.
Azure Monitor
Azure Application Insights (AI) is an extension of Azure Monitor and is currently the monitoring solution we provide for Altinn apps.
AI can provide you as an app developer with valuable insights into the health, performance and usage of your app. With real-time monitoring and performance analytics, developers can identify and resolve issues before they impact the user experience.
Prerequisites
Test Developer or Production Developer role in Azure. Test Developer role grants access to AI for apps in TT02 and Production Developer role grants access to apps in production.
General overview of AI features AI has a number of features available.
Check Microsoft’s official documentation for a quick overview.
Basic knowledge of Kusto Query Language (KQL) Queries in AI are written using KQL. The possibilities within data visualization and exploration are many with KQL, learning the basics will get you a long way in identify data points of interest.
Find an overview of KQL and sample queries on the Microsoft website.
Grafana
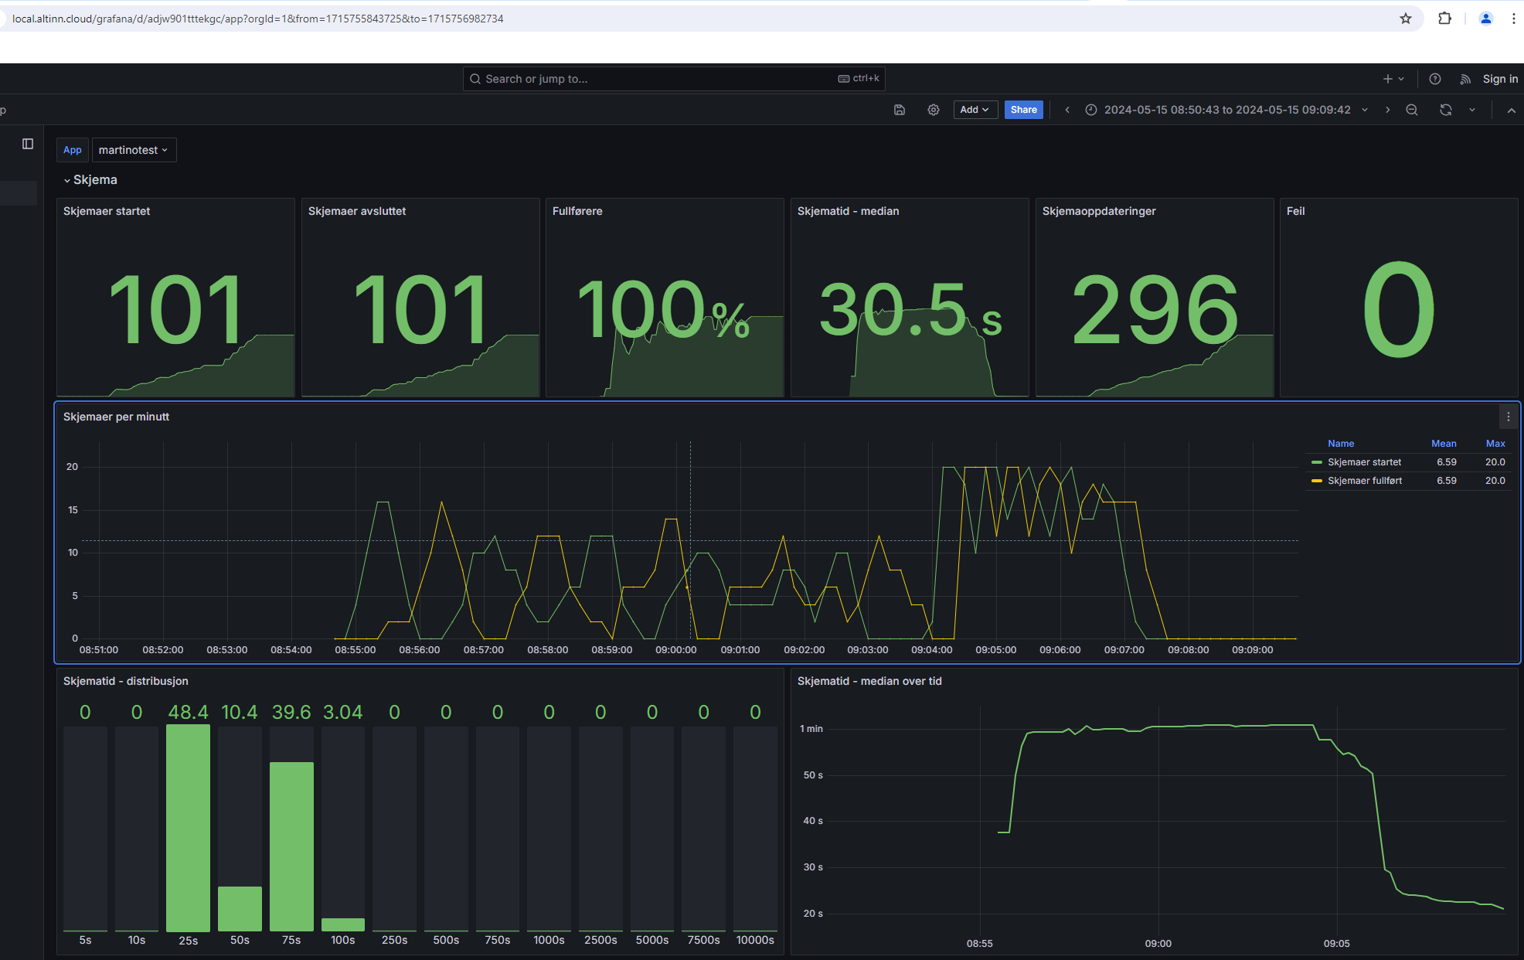
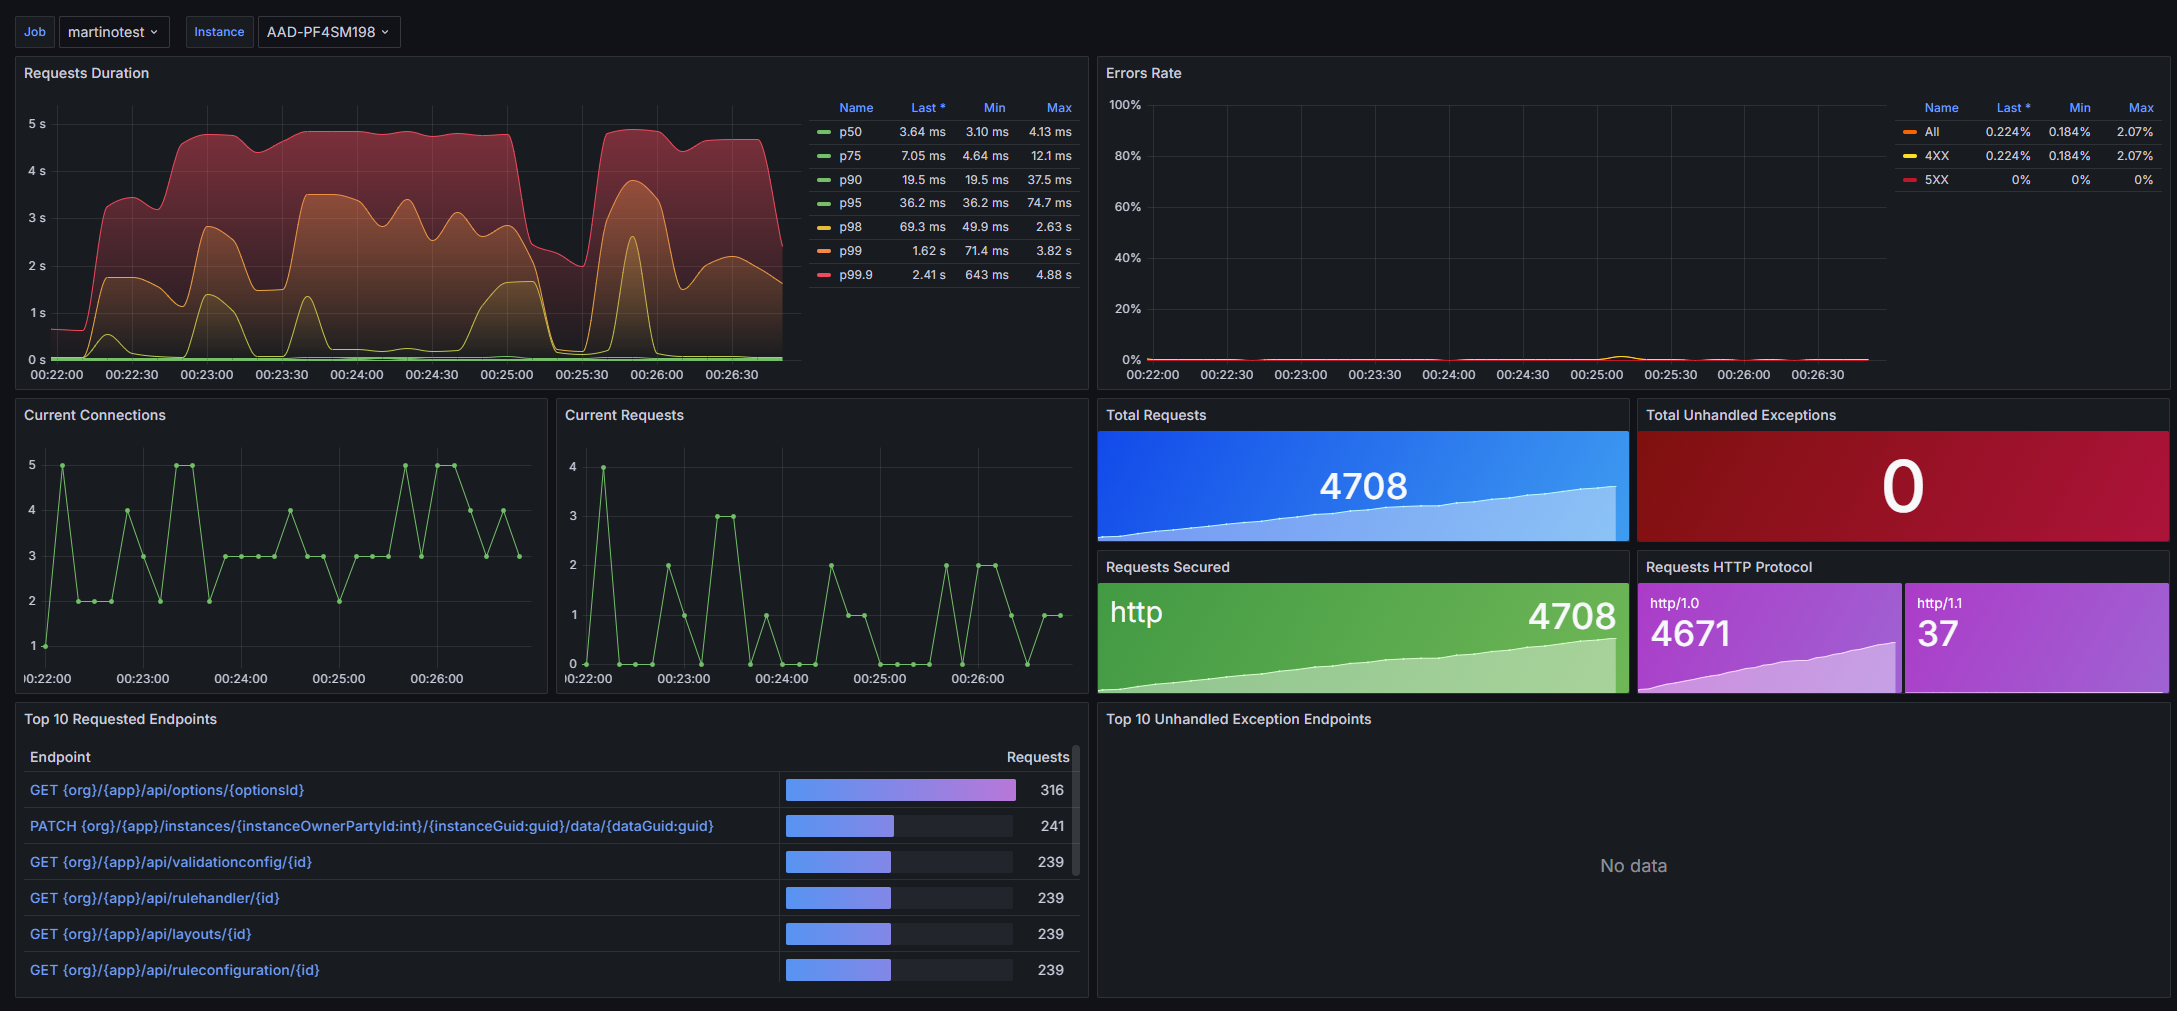
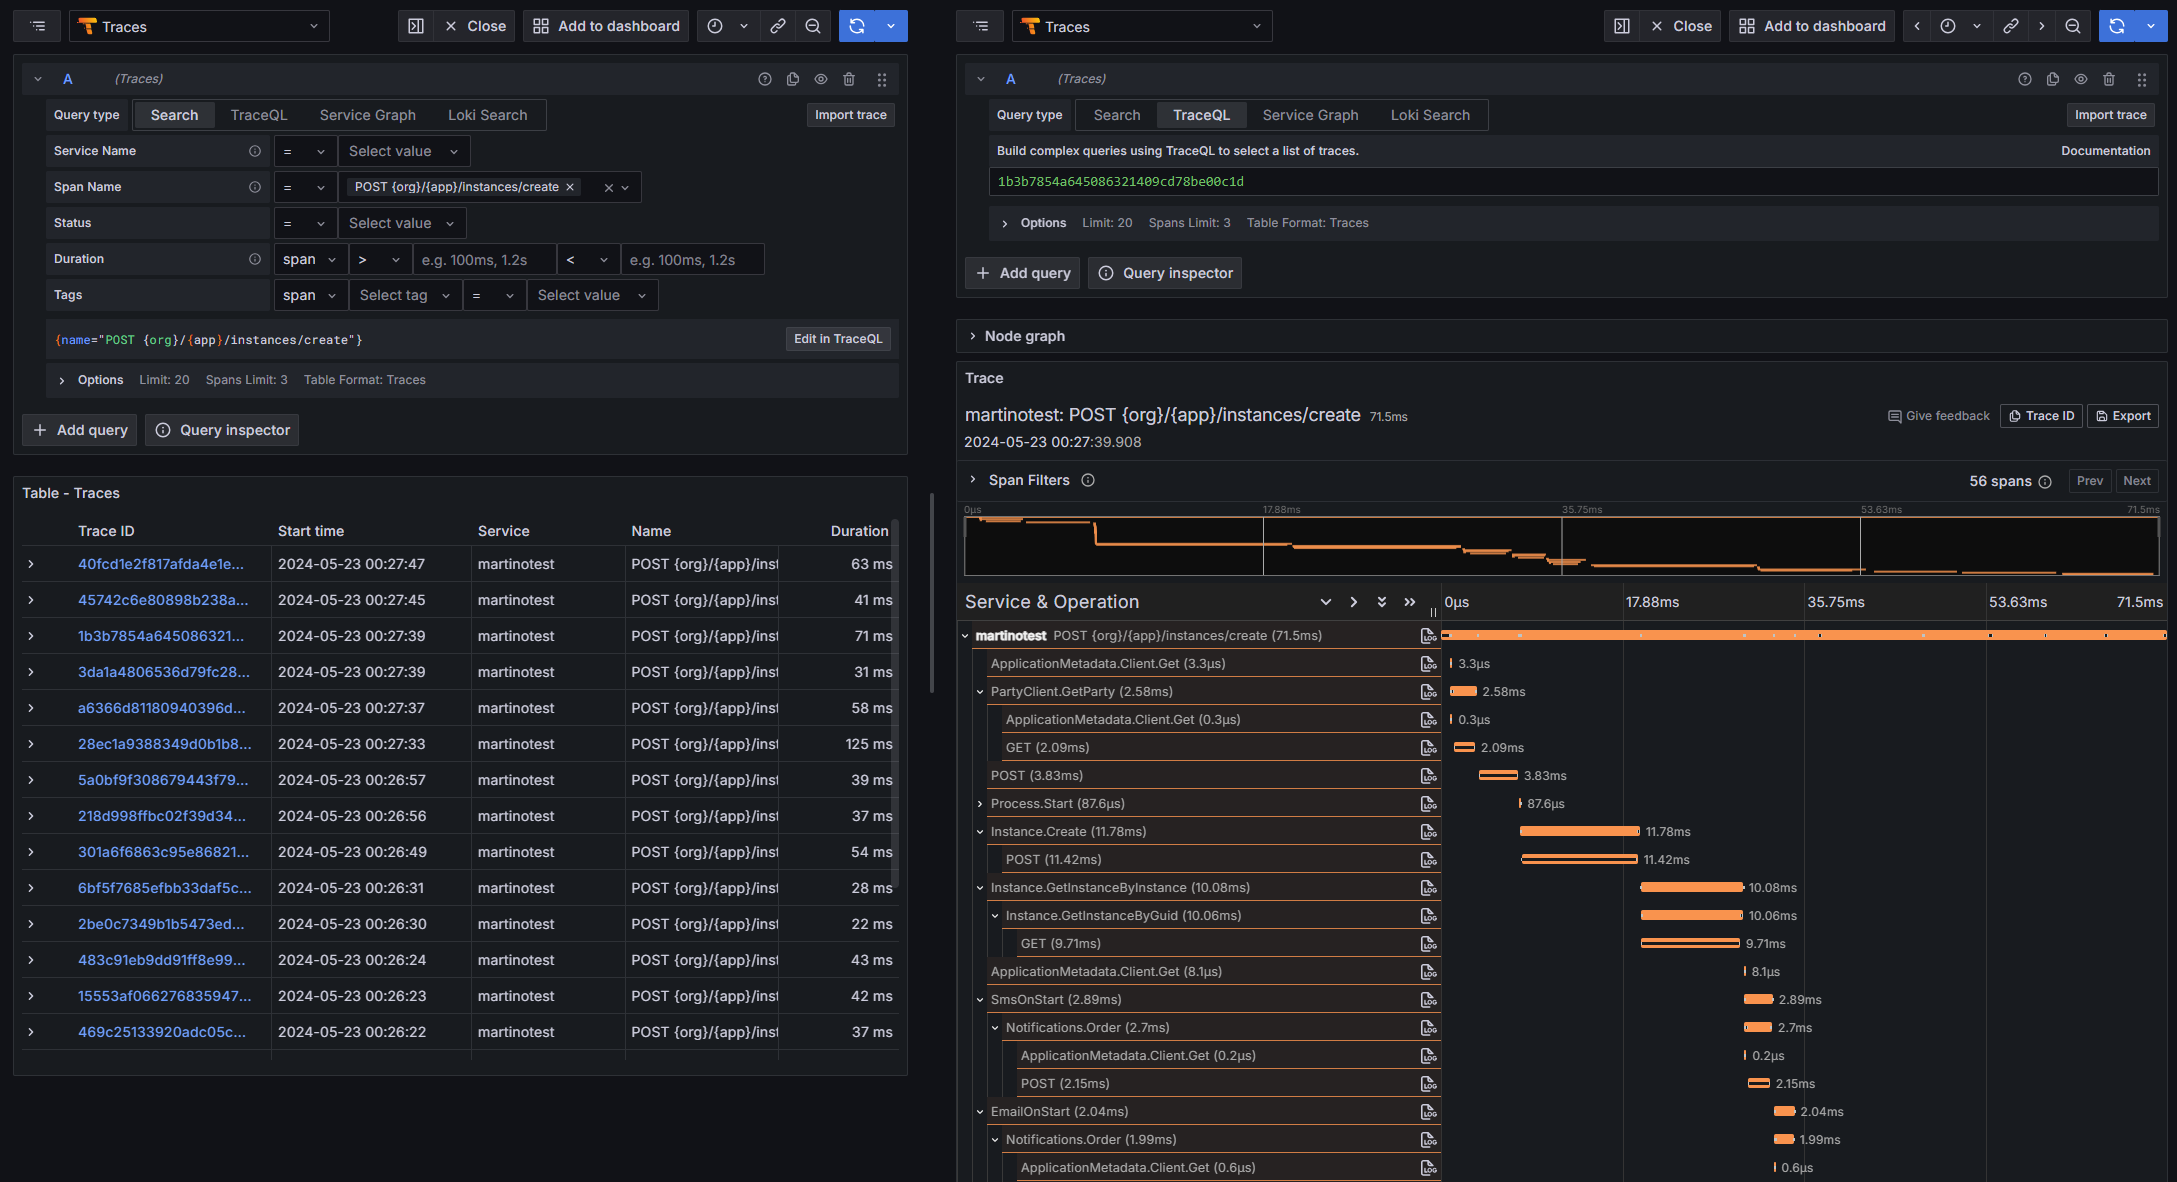
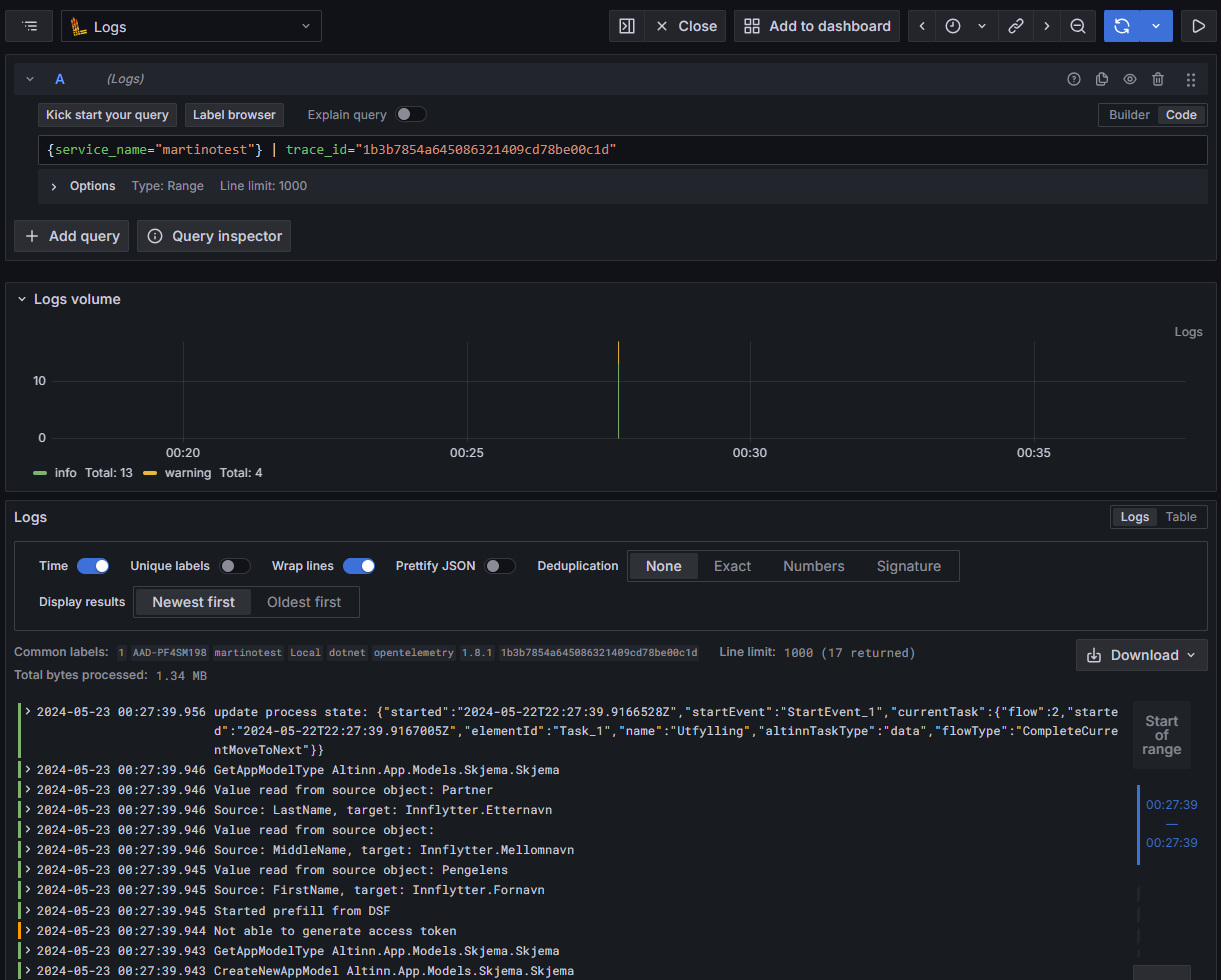
Grafana is as visualisation tool where one can explore telemetry and design dashboards to suite teams monitoring needs. Each app cluster has a Grafana instance which service owners can use. These are still early days for the Grafana installation - in the future, service owners will get the following out of the box:
- Telemetry exploration
- ASP.NET Core dashboards
- .NET runtime dashboard
- Altinn app dashboards (single-app, aggregated)
- Alerting
A preview of the Altinn app dashboard and ASP.NET Core dashboards are available in localtest


