Typical use cases for Application Insights
Frequently asked questions related to how to use Application Insights.
Do you have any good tips or questions that you are in need of answers?
Please contribute to this page by using the Edit page on GitHub feature at the bottom of this page!
The Altinn team has access to all of the telemetry logged by the application that the app owners also have access to. In addition we monitor the infrastructure components for each application owner such as Kubernetes cluster, storage account and key vault.
As a main rule the Altinn team has action plans for alerts related to the infrastructure that is required to run the apps i.e CPU exhaustion in the application cluster or a pod is in an error state in the cluster. Altinn does not actively monitor the performance or failure rates of individual applications.
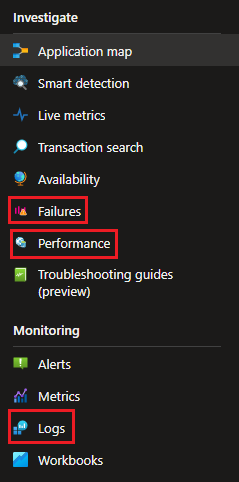
- Failures: get an overview over all failing requests within a time frame and drill into the stack trace to investigate which request in the call chain produces the error response
- Performance: get an overview over all requests withing a time frame. Identify slowest requests and drill into stack trace to investigate which part of the call chain is harming the request performance.
- Logs: query log and trace data to find exception messages or identify custom telemetry related to a specific request
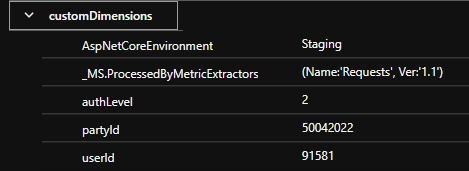
The application template logs identity telemetry whenever this information is available to the app. Data points include authentication level (authLevel), partyId, userId and organisation number (orgNumber).
To present the custom telemetry data when querying the logs use the property customDimensions.
Here is an example of how to list all requests presented by their request url and userId that performed the requests
requests
| project url, customDimensions["userId"]
All logs and dashboard in AI can include filters. Use a role filter to filter out data related to your application. The role (or cloud role name) for your application is equal to your application name (i.e. the repository name in Altinn Studio).
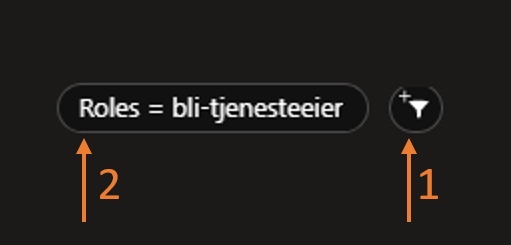
When working with the user interface look for the filter icon (1) and add or adjust the role filter (2).
If working with logs the following where clause is used to filter out the data for your app.
where cloud_RoleName == <insert app name>
To retrieve all request for the application bli-tjenesteeier the query would look like this
requests
| where cloud_RoleName == "bli-tjenesteeier"
When end users report errors this could be an error that affects all users and it is easy to identify the failing request in the failure tab. However, if the error is affecting a single or very few users the instanceId can be a helpful tool.
End users should always include the instanceGuid or archive reference (last 12 chars of an instance guid). This GUID can be included in a filter on the Performance page to get an overview over all incoming requests related to the instance, maybe this can give a clear picture of what has happened.
Alternatively, you can query the log tool for actions related to the instance.
requests
| where url contains "165dc739-0f55-4a4c-9b0b-781340a68cd8"
| order by timestamp desc
… but I don’t know what is causing it.
Ukjent feil in the application is caused by the application returning an unexpected response during a request from the client (app frontend). To investigate situations like these starting in the Failures tab is often the way to go.
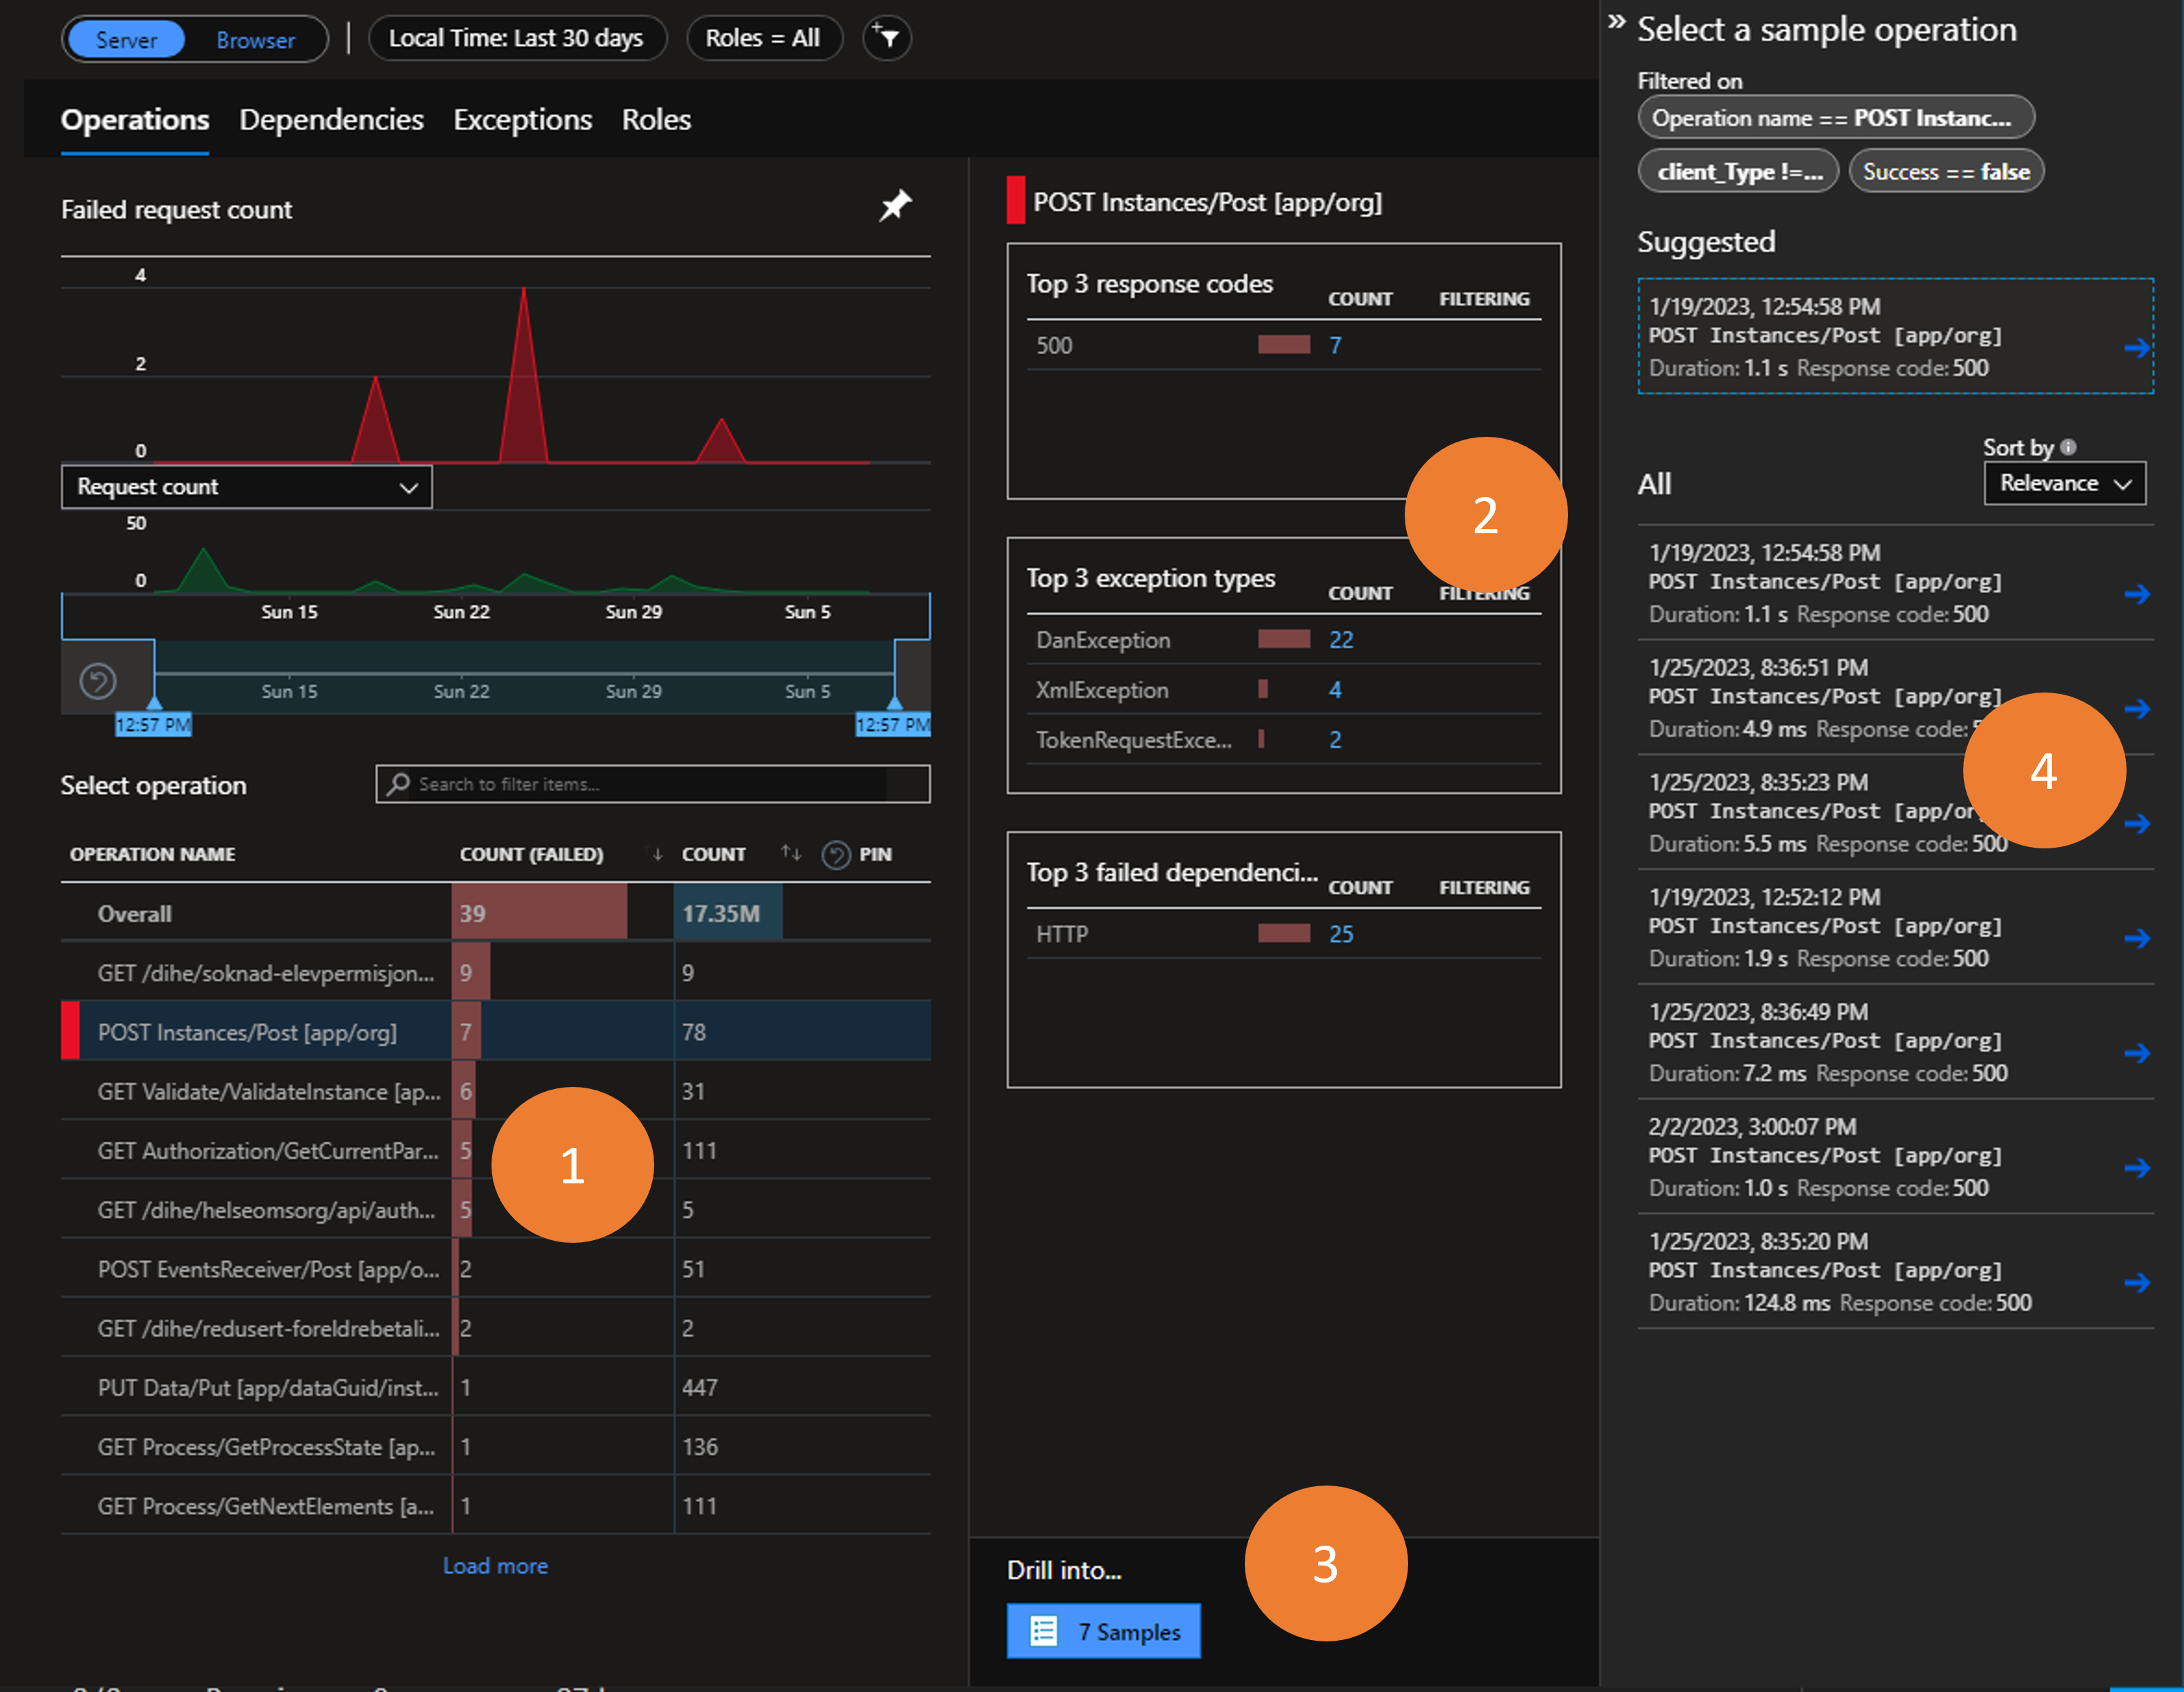
- Based on the scenario when things fail you might be able to identify the correct request in the operation overview. Highlight this request.
- In the summary section you will see top three response codes and exception types related to the failing request.
- If further investigation is required you may drill into the request samples.
- Instances of the request are listed and you may sort them based on relevance or date. Click one of the requests to be forwarded to the end-to-end transaction details.
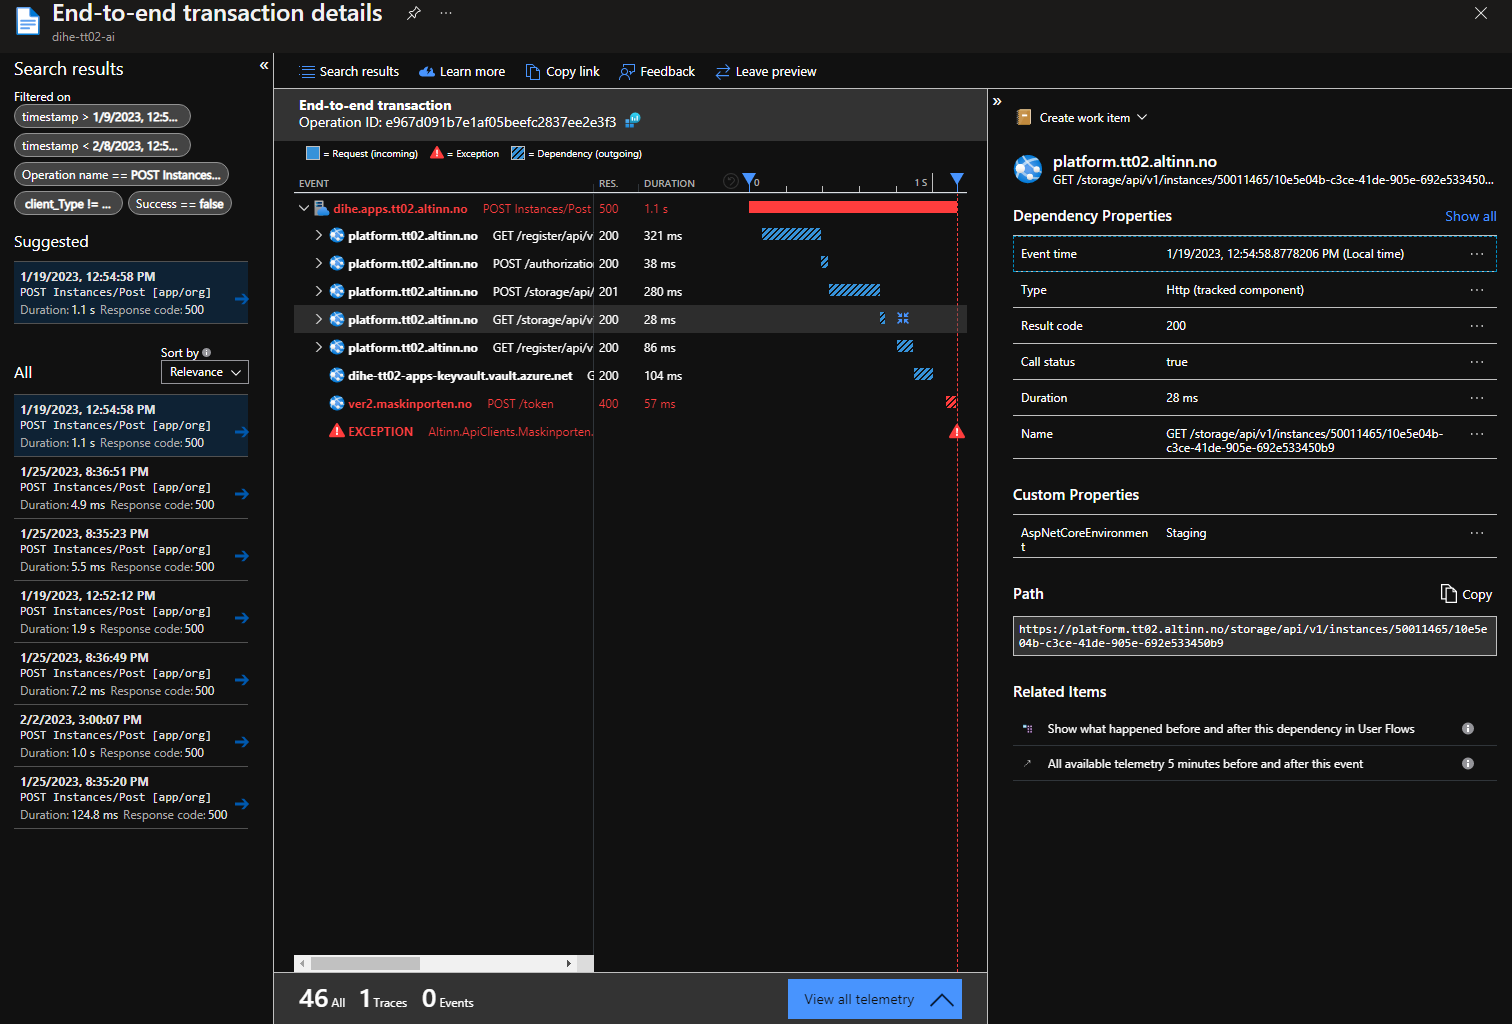
Looking through the transactions all requests with a non-successful response code will be marked in red. To see addition details for a specific request highlight it and review the blade on the right hand side of the screen.
Use the Performance page to investigate slow requests
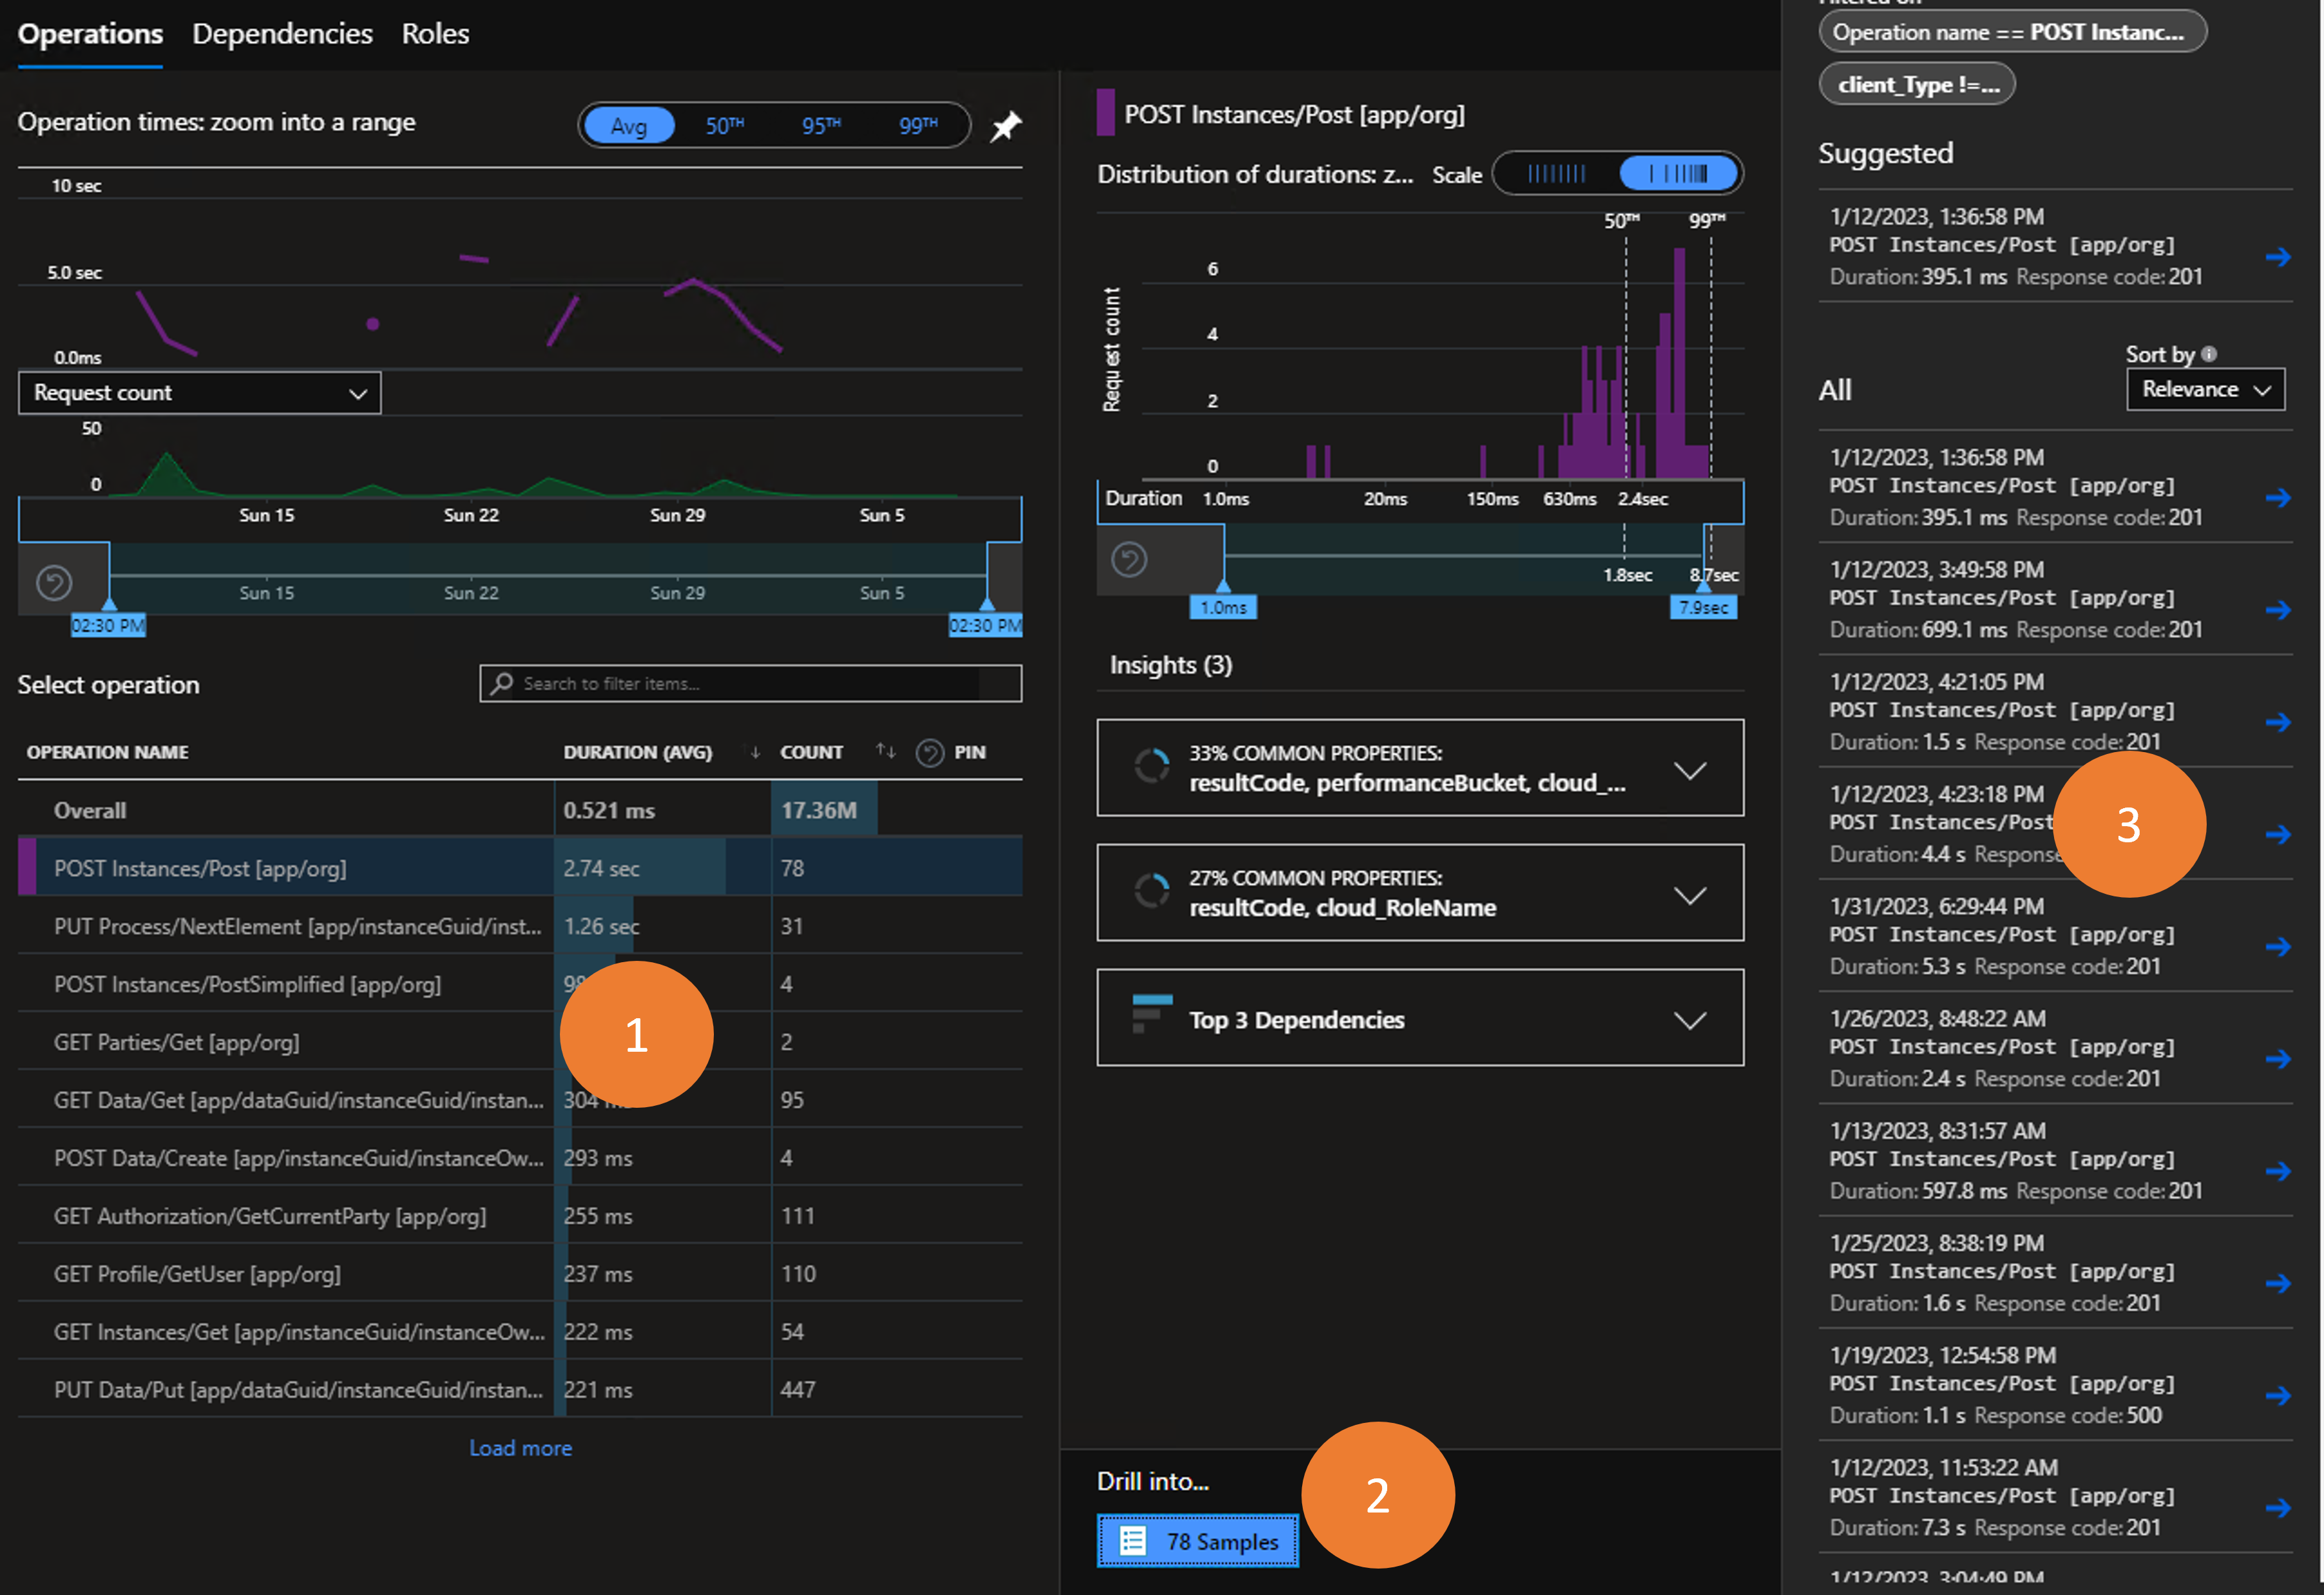
- Identify the request you are interested in
- Click the Drill into x samples button
- Select one of the requests in the list to be shown the end-to-end transaction details.

From this point one can investigate each dependency and the time it takes to get a response.


